Warning: package 'dplyr' was built under R version 4.2.3There are scattered instances across all three DDE species of an miRNA having multiple putative binding sites (<10) in a single gene, usually appearing in the CDS region (covered in detail here). However, there is one instance of a remarkably high number of binding sites – in A. pulchra, miR-100 has a remarkable 74 putative binding sites in the CDS of the gene FUN_014449. Frankly, this seems like a suspiciously high number (eg., maybe all the sites are just slight variants shifted by 1nt or something), so let’s double check it’s real.
Look at the Apul CDS miRanda+PCC results
The “raw” (ShortStack-assigned) ID for miR-100 in Apul is Cluster_18728
mir <- read.csv("https://gannet.fish.washington.edu/kdurkin1/ravenbackups/deep-dive-expression/D-Apul/output/09.01-Apul-mRNA-miRNA-interactions-CDS_5UTR/miRanda_PCC_miRNA_CDS.csv") %>% select(-X)

mir100 <- mir %>% filter(V1 == "Cluster_18728" & V4.y == "FUN_014449")
head(mir100)
V1 V2 V3 V4.x V5 V6 V7 V8 V9 V10
1 Cluster_18728 ptg000009l:287232-304756 142 -20.19 2 21 6523 6548 23 60.87%
2 Cluster_18728 ptg000009l:287232-304756 143 -22.81 2 21 4426 4451 23 56.52%
3 Cluster_18728 ptg000009l:287232-304756 144 -20.22 2 18 8317 8339 17 70.59%
4 Cluster_18728 ptg000009l:287232-304756 144 -21.55 2 18 4411 4433 17 70.59%
5 Cluster_18728 ptg000009l:287232-304756 144 -21.55 2 18 4519 4541 17 70.59%
6 Cluster_18728 ptg000009l:287232-304756 145 -20.53 2 21 7954 7979 23 65.22%
V11 V4.y PCC.cor p_value adjusted_p_value
1 69.57% FUN_014449 -0.9377878 0.01845238 0.8503098
2 69.57% FUN_014449 -0.9377878 0.01845238 0.8503098
3 70.59% FUN_014449 -0.9377878 0.01845238 0.8503098
4 70.59% FUN_014449 -0.9377878 0.01845238 0.8503098
5 70.59% FUN_014449 -0.9377878 0.01845238 0.8503098
6 73.91% FUN_014449 -0.9377878 0.01845238 0.8503098The relevant columns here are V7 and V8. These show, respectively, the beginning and end position of the predicted binding region in the gene’s scaffold (V2). If these 74 predicted binding locations are actually just extremely similar “variants”, we’d expect many rows to share very similar V7 and V8 values. When I eyeball the table I don’t see that trend, but let’s check it rigorously to be sure.
Use IRanges, a package built to work with genomic intervals/positions.
ranges <- IRanges(start = mir100$V7, end = mir100$V8)
# which ranges overlap?
hits <- findOverlaps(ranges)
# Overlapping row pairs
overlap_pairs <- as.data.frame(hits)
# Filter out self-overlaps
overlap_pairs <- overlap_pairs[overlap_pairs$queryHits != overlap_pairs$subjectHits, ]
# Remove mirrored pairs
overlap_pairs <- overlap_pairs[overlap_pairs$queryHits < overlap_pairs$subjectHits, ]
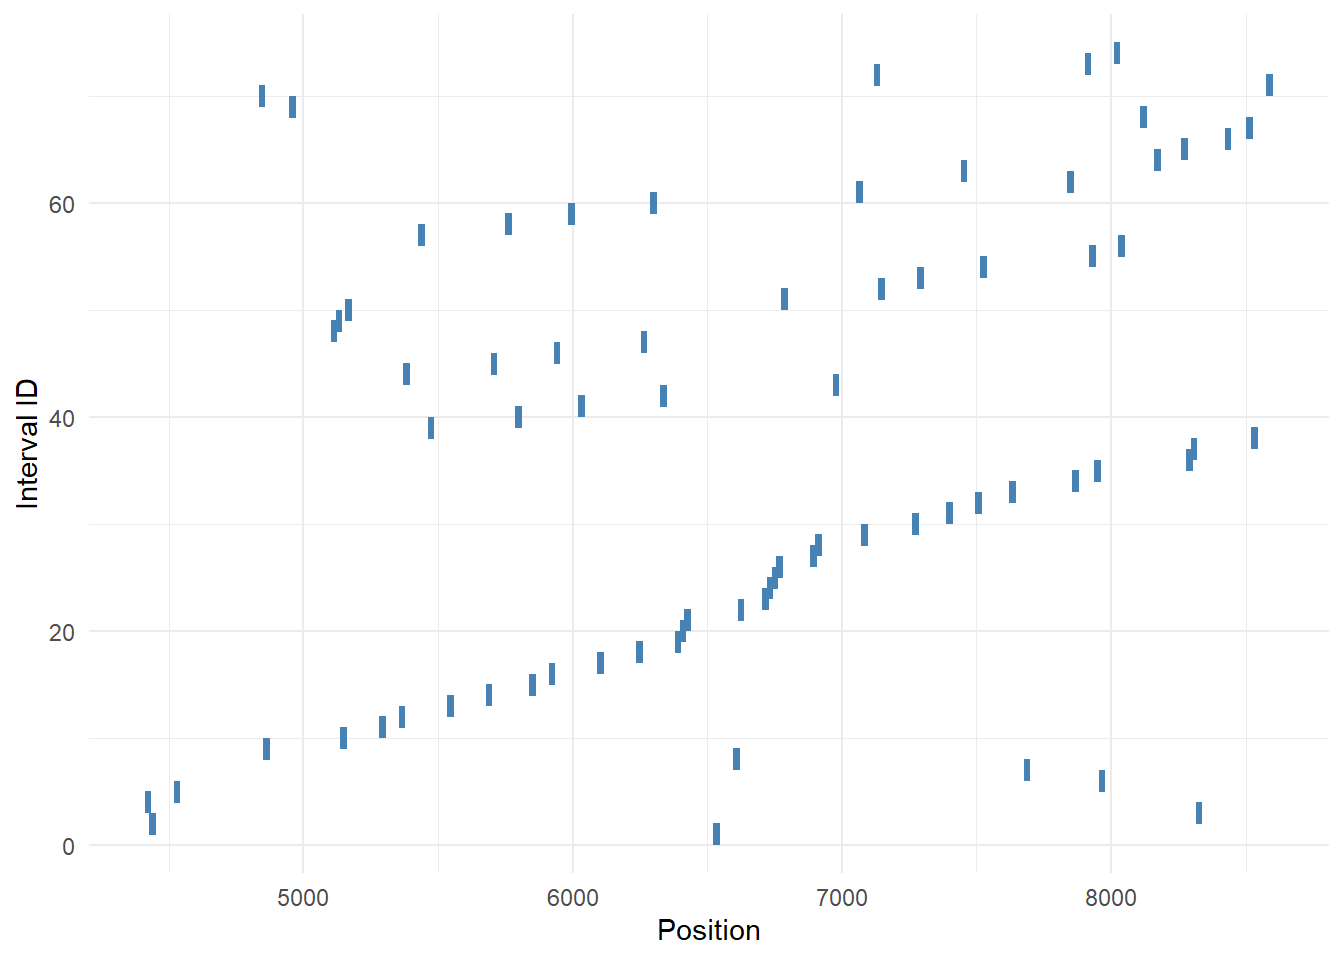
nrow(overlap_pairs)[1] 30For the 74 putative binding regions, there are 30 instances of region overlap. That means the majority of regions are distinct from each other!
Triple-check by plotting (quick and dirty genome browser)
mir100$id <- 1:nrow(mir100)

ggplot(mir100, aes(x=V7, xend=V8, y=id, yend=id)) +
  geom_segment(size=4, color="steelblue") +
  labs(x="Position", y="Interval ID") +
  theme_minimal()
Warning: Using `size` aesthetic for lines was deprecated in ggplot2 3.4.0.
ℹ Please use `linewidth` instead.